
Externalities (AS/A LEVELS/IB/IAL)
Externalities (AS/A LEVELS/IB/IAL)
Level: AS Levels, A Level, GCSE – Exam Boards: Edexcel, AQA, OCR, WJEC, IB, Eduqas – Economics Revision Notes
Externalities
The price mechanism does not always allocate resources efficiently causing market failure. The government intervenes in various ways to correct this.
Externalities are caused by market failure. Externalities can be positive or negative.
Externalities are third party impacts (Spill-overs) of the production or consumption of a good or service.
Externalities can occur in both consumption and production.
Exam Tip: It’s important to remember that MPC (Supply Curve) equals MPB (Demand Curve). Therefore this will always be your starting equilibrium point for a negative or positive externality diagram.
Positive Externality – Curves
- Marginal Private Benefit (MPB)
- Marginal External Benefit (MEB) or (EB)
- Marginal Social Benefit (MSB)
Negative Externality – Curves
- Marginal Private Cost (MPC)
- Marginal External Cost (MEC) or (EC)
- Marginal Social Cost (MSC)
Positive Externalities
Positive externalities are third party benefits gained from the consumption or production of a good or service. Externalities can occur in both consumption and production.
Example:
Consumption of flu medication prevents others from catching the flu.
Private Benefits
These occur through positive externalities when something is consumed or produced. For example, the pleasure and amusement someone gets from going to watch a theatre show.
External Benefits
This occurs in the consumption or production of positive externalities. For example, if consumers use public transport rather than driving to work they will be helping to reduce the impacts of pollution.
Social Benefits
This is the full benefit of consumption or production. This occurs when external benefits are also taken into account and not just private benefits.
Social Benefits = Private Benefits + External Benefits
Positive Externality In Consumption – Diagram
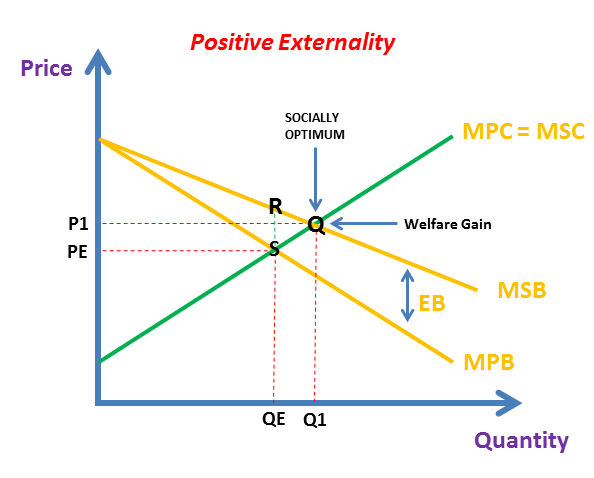
- The initial equilibrium in a free market is at PE-QE.
- At this point, there is too little consumption of this positive externality (Flu vaccine).
- At PE-QE consumers of the flu vaccine only care about their private benefits.
- However, there is an external benefit associated with taking a flu vaccine.
- This vaccine will also help to reduce the spreading of this flu and stop others from catching it.
- When the external benefit of the flu vaccine is taken into account the demand curve will shift to the right creating the MSB line. This highlights an increase in supply.
- MSB = MPB + MEB.
- P1 – Q1 shows an increase in the consumption of this positive externality to the socially optimum point Q.
- Welfare gain = QRS.
Negative Externalities
Negative externalities are third party costs caused by the production or consumption of a good or service.
Examples:
A negative externality of consuming a pack of crisps could be the litter dropped on the streets.
There is also a negative externality associated with people driving to work. This will cause a negative spillover due to air pollution. This polluted air is then consumed by 3rd parties.
Private costs
This is the cost of production to a firm or the price paid by the consumer for a good or service. For example, if a consumer purchases a cigarette. The private cost would be the price paid for them.
External costs
These are caused by the consumption or production of negative externalities. For example, if someone is smoking then others will end up inhaling this passive smoke. This will cause a larger strain on the NHS.
Social cost
The is the full cost of consumption or production. This occurs when external costs are also taken into account and not just private costs.
Social costs = Private costs + External costs
Negative Externality In Production – Diagram

- The initial equilibrium in a free market is at PE-QE.
- At this point, there is too much produced of this negative externality (Oil).
- At PE-QE oil producers only care about their private costs.
- However, there is an external cost associated with the extraction and production of oil.
- When the external cost (pollution) of oil production is taken into account the supply curve will shift to the left creating the MSC line. This highlights a decrease in supply.
- MSC = MPC + MEC
- P1 – Q1 shows a decrease in the production of this negative externality to the socially optimum point Q.
- Welfare loss = QRS
Government Intervention for Negative Externalities
Subsidies
- Subsidies encourage the consumption of merit goods and includes the full social benefit
Indirect Taxes
- Indirect Taxes reduce the quantity of demerit goods consumed by increasing the price of them
- The externality becomes internalised if the indirect tax is equal to the external cost of each unit and the supply curve becomes MSC instead of MPC
Regulation
- Regulation helps to restrict the overconsumption of certain goods / services
- Bans can prevent the consumption of harmful goods
- Although bans can be helpful, they may still be consumed on the black market
Public Goods
- These are goods which are underprovided in the free market, hence the Government intervenes to provide them for consumers to benefit from
- Examples of a public good / service: free healthcare, education, infrastructure (transport network)
Symmetric Information
- Providing consumers and firms with symmetric information so they can make informed decisions
AQA Spec – Additional Content
Why does the absence of property rights leads to production and consumption externalities
- Market Inefficiency – An absence of property rights results in the inefficient operation of markets
- Exploitation – On some goods / services, it is impractical for there to be property rights – this can result in the exploitation of the good as free riders have unlimited access to it
- Moral Hazard – This refers to the idea that someone else will pay for the consequences of a bad choice
- Scarce Resources – These can be over-used or over-exploited
Quick Fire Quiz – Knowledge Check
1. Define ‘Externalities (2 marks)
2. Distinguish between a positive and a negative externality (4 marks)
3. Identify two examples of a positive externality – one occurring in consumption and the other occurring in production (3 marks)
4. Draw a positive externality diagram, highlighting the socially optimum point and area of welfare gain (4 marks)
5. Using an example, explain what a positive externality diagram shows (6 marks)
6. Identify two examples of a negative externality – one occurring in consumption and the other occurring in production (3 marks)
7. Draw a negative externality diagram, highlighting the socially optimum point and area of welfare loss (4 marks)
8. Using an example, explain what a negative externality diagram shows (6 marks)
9. Explain the difference between MSB, MPB, and MEB (4 marks)
10. Explain the difference between MSC, MPC, and MEC (4 marks)
11. Explain what the socially optimum point on an externality diagram shows (2 marks)
12. Explain forms of Government Intervention for Negative Externalities (10 marks)
Next Revision Topics
- Government Failure
- Merit & Demerit Goods
- Free Market, Mixed and Command Economies
- Public and Private Goods
A Level Economics Past Papers